By regularly monitoring your HRV, you can optimize your preparation, fine-tune your training, manage stress effectively, and monitor your recovery.
How to start
To import HRV data into Athlete Analyzer you need to connect your account with either Garmin Connect or Polar Flow. Click here to find out how.
The Nightly HRV chart
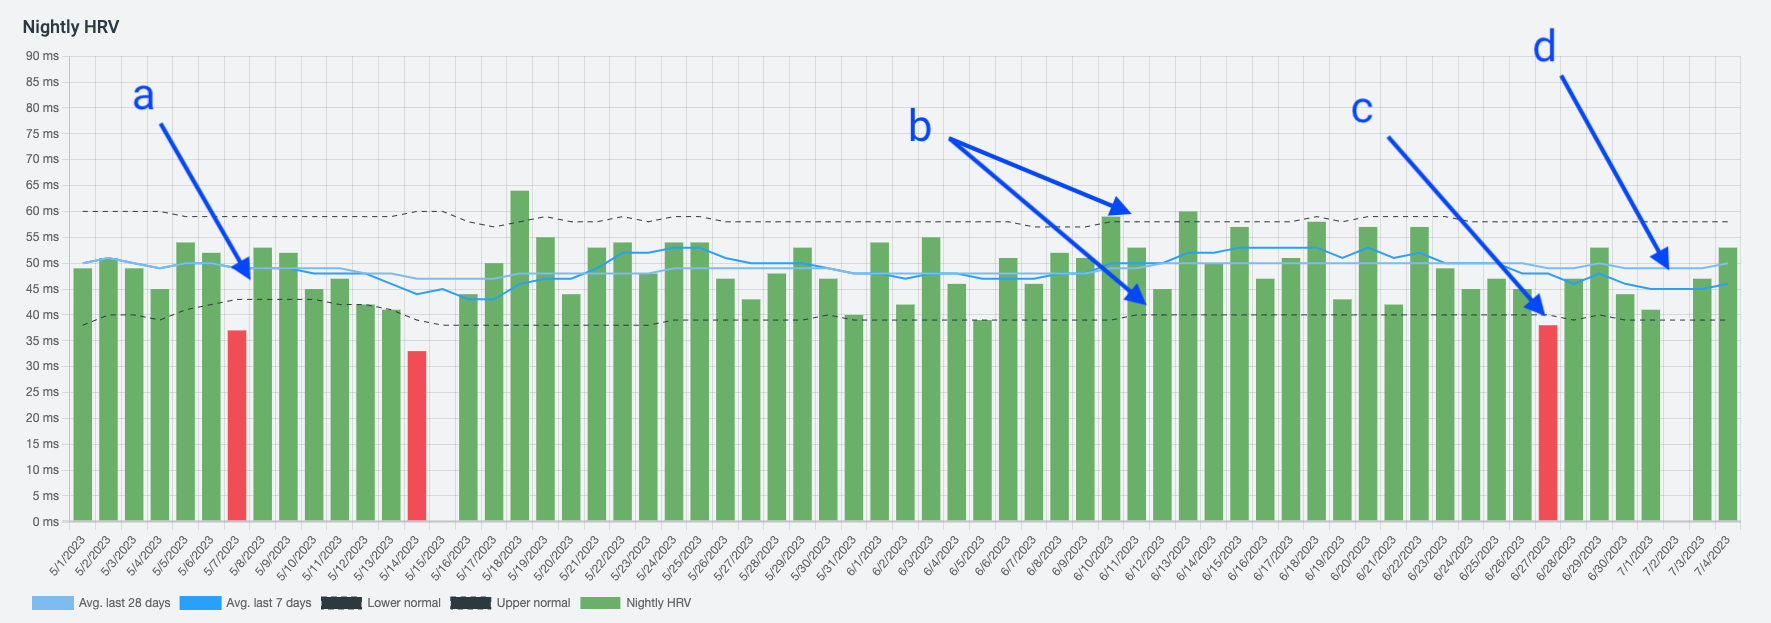
a: Each bar shows your average HRV during the night. The value you see is very personal and you can not compare your values to another athlete’s values.
b: The dotted lines show your normal range. Values within these lines can be considered normal.
c: A red bar means that the value is below your normal range. A low HRV value can indicate many things such as stress, need for recovery, or pending illness.
d: The average lines show your HRV trend. With training, it should increase over time as your body’s fitness improves. However, if your HRV is getting lower over time it could indicate that something is wrong. Maybe your body can’t cope with the amount of training you do for example.