The charts in Athlete Analyzer Judo Training Insights will give you a good insight in current and past fitness, fatigue, performance and injury risk for you or your athletes. You can use the graphs as a help to avoid over training and also plan tapering before competitions. The graphs are indicative tools and do not provide an absolute truth as there are several other parameters that can affect the actual form as nutrition, sleep etc.
Training Load (TL)
Training Load is based on (Session RPE x Minutes) giving a Training Load Value for each of the athlete’s workouts.
For a workout of 60 minutes at a sRPE of 8 the Training Load will be 8 x 60 = 480.
Session RPE (sRPE)
Every workout has a planned exertion ranging from 1 to 10 based on “Session RPE” (Rating of Perceived Exertion). When the workout is performed the athletes report their actual Session RPE using the table below as a reference. It is very important that sRPE is reported as carefully as possible for the analyses to be accurate. The reported sRPE should reflect the whole workout, not only the hardest exercise in the workout.
| RPE | ||
|---|---|---|
| 1 | BorgNone | No exertion at all. Like relaxing in the bed. |
| 2 | BorgVeryVeryLight | Minimal recognition of effort. |
| 3 | BorgVeryLight | You can just start to hear your breathing. |
| 4 | BorgFairlyLight | Conversation is easy and you feel you can run for a while in this pace. |
| 5 | Moderate | You can hold a short conversation. |
| 6 | BorgSomewhatHard | You can hear your breathing but you're not struggling. |
| 7 | BorgHard | Hard work. You can use one or two word answers. |
| 8 | BorgVeryHard | Very hard , starting to get uncomfortable and you're getting tired. |
| 9 | BorgVeryVeryHard | You can no longer talk because your breathing is heavy. |
| 10 | Max | Max exertion. |
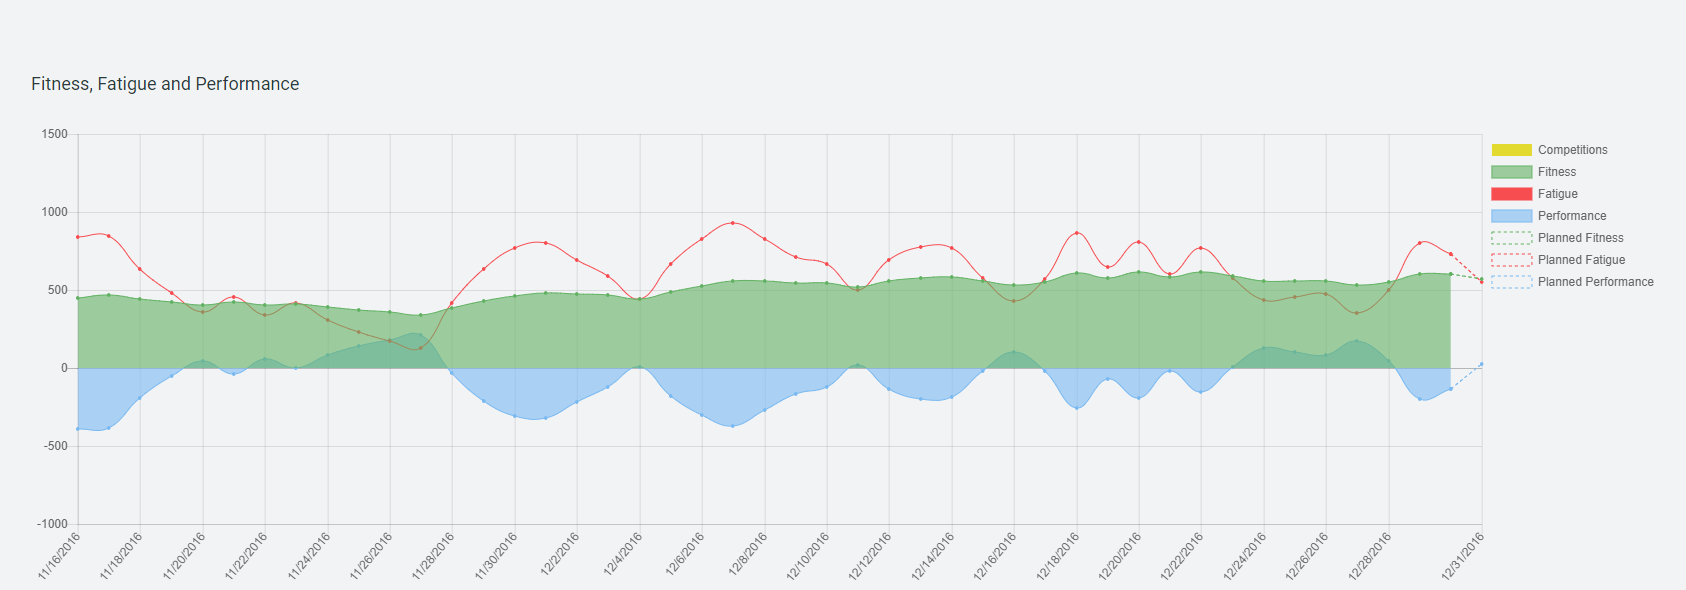
The analysis model assume that training has both a positive and a negative effect. The positive effect is called Fitness and the negative effect is called “fatigue”. They are combined to provide “Performance”.
Fitness (or Chronic Training Load, CTL) represent the amount of training (Training Load, TL) you have done the last 42 days. Fitness is displayed as green in the graph.
Fatigue (or Acute Training Load, ATL) represent the fatigue you have built based on the amount of training (Training Load, TL) the last 7 days. Fatigue is displayed as red in the graph.
In other words, a workout session benefits your fitness and is declining during 42 days but also affects you fatigue level which will decline during 7 days.
Performance (or readiness to perform, or in short, Form) is calculated by subtracting your current Fatigue from your current Fitness (CTL-ATL). After a week with higher TL than usual your Form will be below zero. A week with reduced workload will bring your Form up over zero which is used for tapering before competitions. Please notice that future planned workouts also are shown in the graph as dotted lines as a guidance for tapering planning. Form is displayed as blue in the graph.You can also see competitions as yellow dots attached to the Form. Hover over the graph to see the details. Click on the legends to show/remove graph lines.
Injury risk (acute:chronic workload)
Studies (Gabbet et all) shows that the ratio between chronic and acute training load is one of the best predictors of injury. If you increase your training load significantly compared to the weeks before you are more in risk for an injury. A high ratio means that you’re training too much with regard to how much you are used to (a high fatigue and a low fitness).
A ratio below 0.8 indicates that your fitness level are going down due to not enough training.
A ratio between 0.8 – 1.3 is an optimal area for your training, trigging positive adaptions and is displayed as green in the graph.
A ratio between 1.3 – 1.5 implicates a moderate risk for injuries and is displayed as yellow in the graph.
A ratio over 1.5 implicates a high risk for injuries and is displayed as red in the graph.
Please remember that these ratios are no absolutely truth because many other parameters can affect the actual injury risk but it can be an indicative tool for avoid over training especially after recent injuries or training breaks etc.
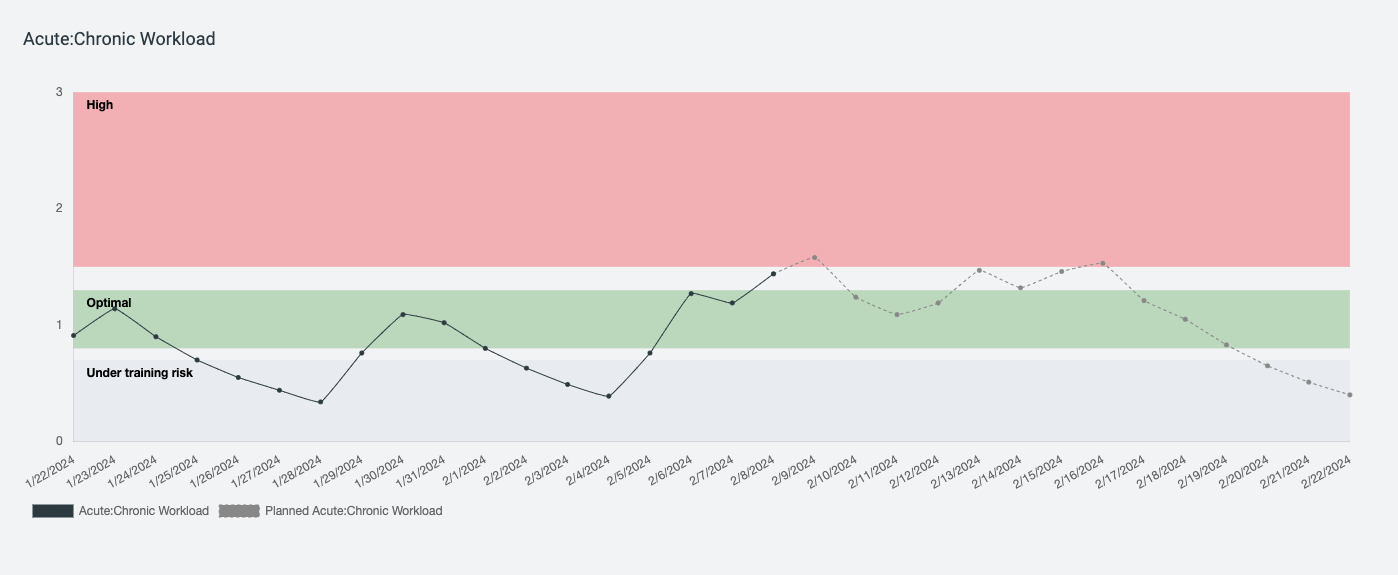
The dotted future line is based on workouts currently planned in your training calendar.
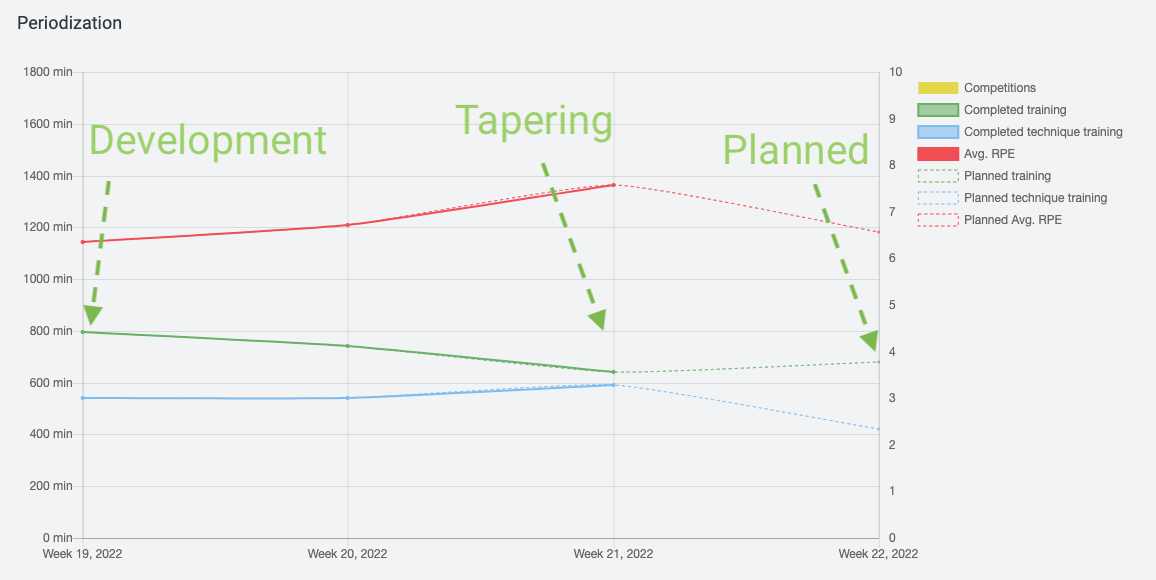
Periodization
The periodization chart visualises the amount of training performed in relation to intensity. Amount measured in minutes and intensity in average RPE. It also shows the amount of technique training in relation to all training done. Workouts that have a sport as training category count as technique training, for example Judo, Taekwondo, Assault (fencing) and so on.
How can it be used? The chart can be used to help balance your training depending on which period you are in. Typically, when tapering for an important competition you want to decrease the total volume and increase the intensity. You probably also want to focus more on technique training.On the other hand, in a development period you probably want to increase your training volume and in order to cope with the increase in volume, you probably need to decrease your intensity.